Organization chart/HR related data
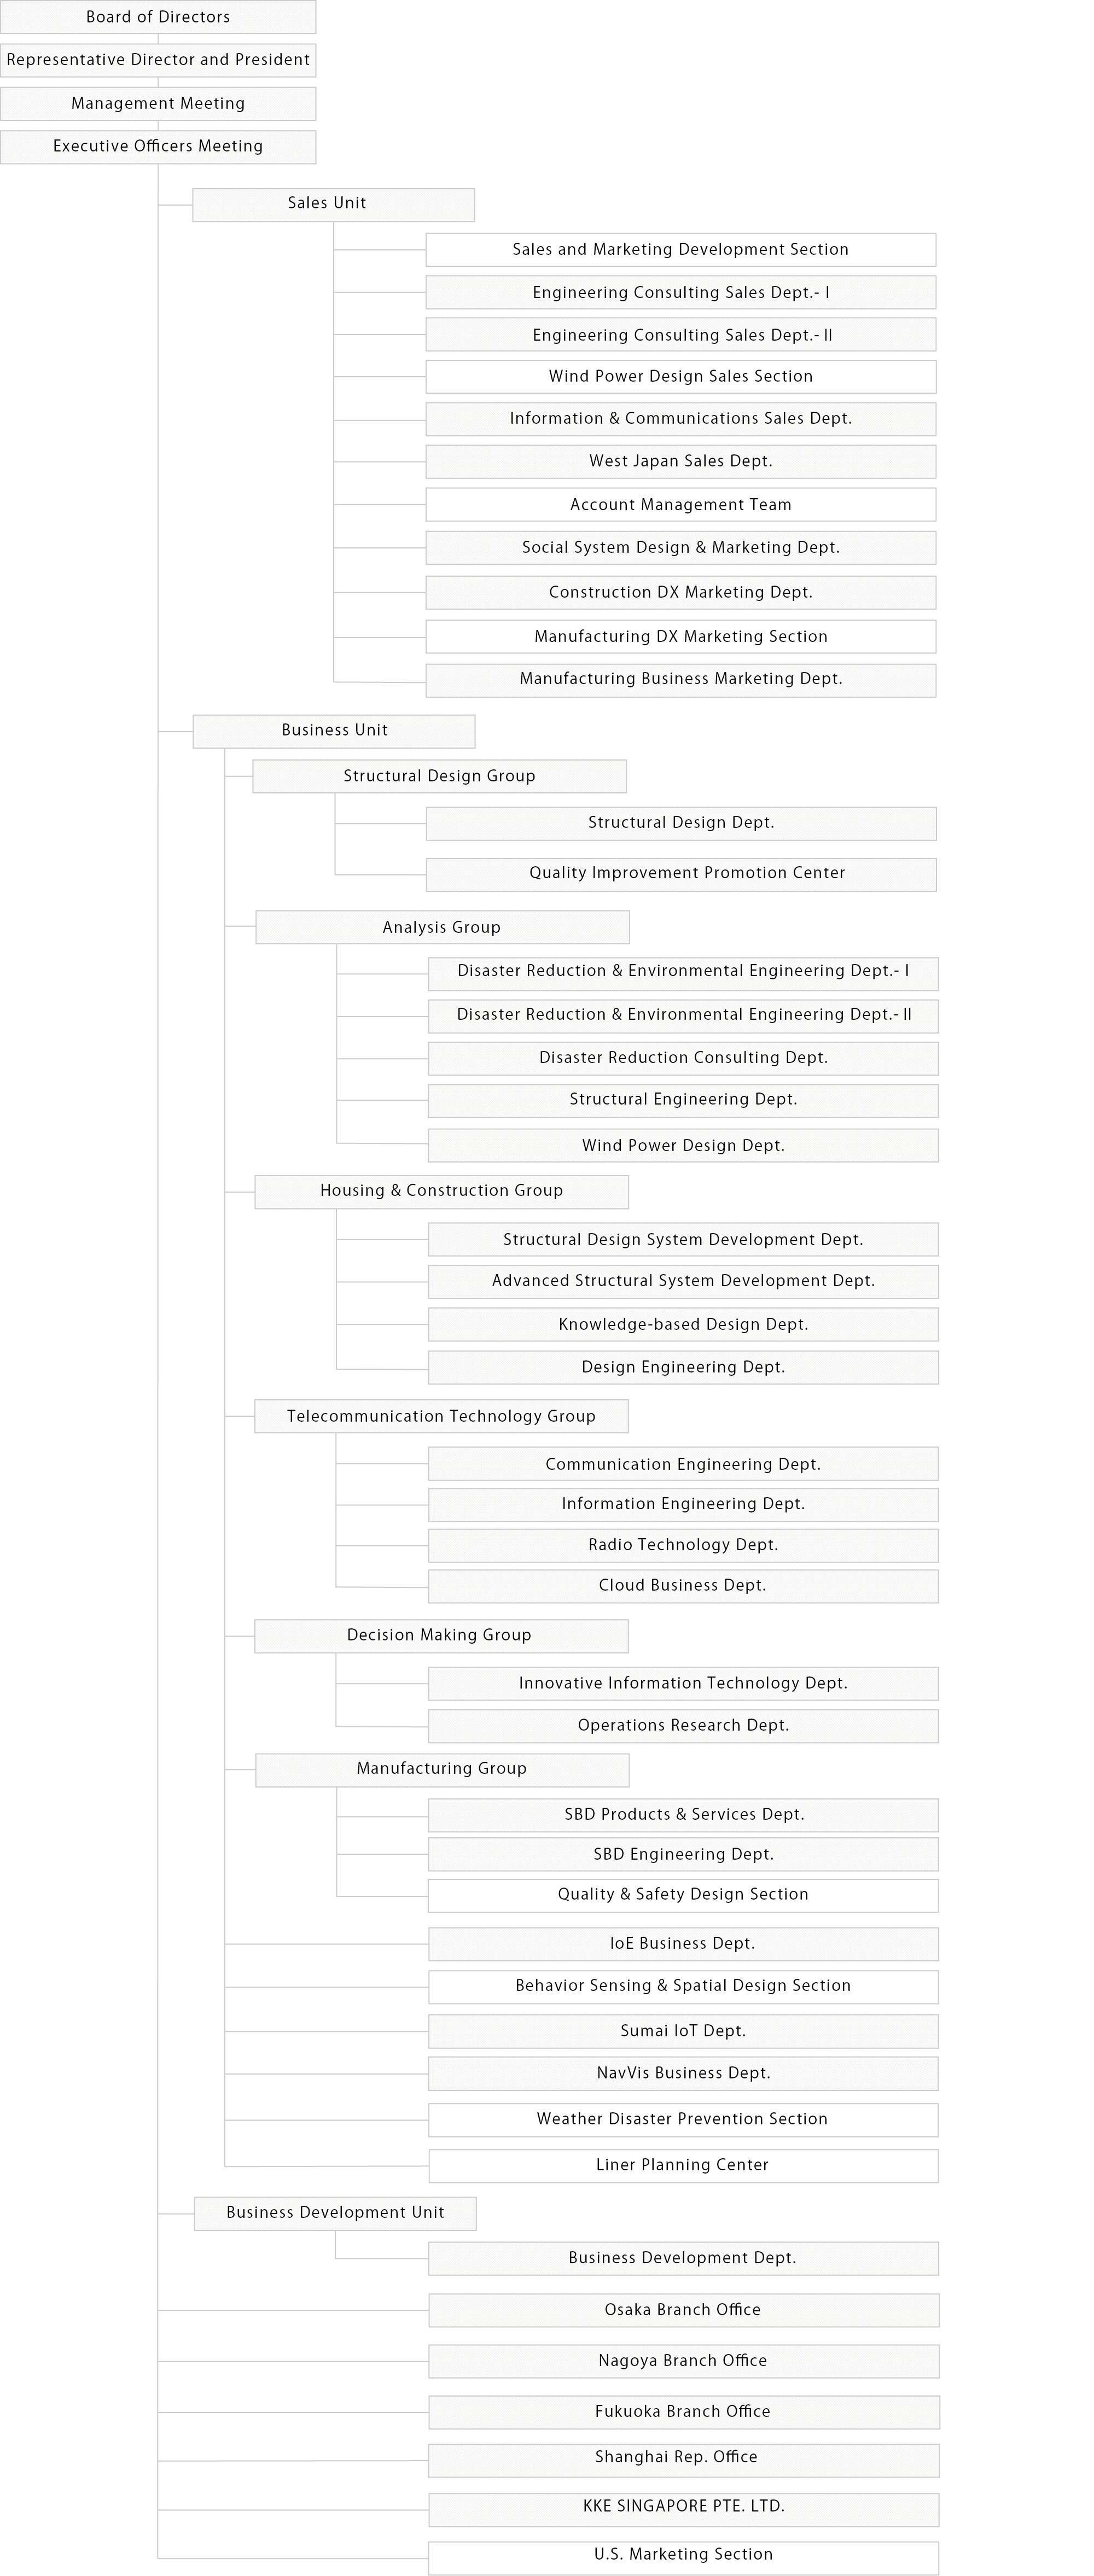
Organization chart
Revised on August.2025
Data on Employees, etc.
| Fiscal Year Ending June 30, 2023 |
Fiscal Year Ending June 30, 2024 |
Fiscal Year Ending June 30, 2025 |
||
|---|---|---|---|---|
| Number of employees, etc.* | ||||
| Number of employees, etc.* |
Total Male Female |
642 471 171 |
644 475 169 |
639 469 170 |
|
Japanese Non-Japanese |
602 40 |
598 46 |
588 51 |
|
| Average age | ||||
| Average age |
All employees, etc. Male Female |
41.7 42.2 40.2 |
41.7 42.3 39.8 |
41.8 42.5 39.7 |
| Average service years | ||||
| Average service years |
All employees, etc. Male Female |
14.8 15.2 13.5 |
14.7 15.3 13.0 |
14.8 15.6 12.8 |
| Average annual salary | ||||
| Average annual salary |
All employees, etc. |
986 |
1,031 |
1,056 |
| Fiscal Year Ending June 30, 2023 |
Fiscal Year Ending June 30, 2024 |
Fiscal Year Ending June 30, 2025 |
||
|---|---|---|---|---|
| Employment of new graduates | ||||
| Employment of new graduates |
Total Male Female Non-Japanese |
43 31 12 11 |
33 19 14 9 |
23 15 8 7 |
| Employment of experienced professionals | ||||
| Employment of experienced professionals |
Total |
13 | 8 | 10 |
| Ratio of employment of experienced professionals | ||||
| Ratio of employment of experienced professionals |
Total (%) |
23.2 | 19.5 | 30.3 |
| Number of employees, etc. who left the company | ||||
| Number of employees, etc. who left the company |
Total |
31 | 34 | 66 |
| Turnover rate | ||||
| Turnover rate |
Total (%) |
4.8 | 5.3 | 10.3** |
| Fiscal Year Ending June 30, 2023 |
Fiscal Year Ending June 30, 2024 |
Fiscal Year Ending June 30, 2025 |
||
|---|---|---|---|---|
| Number of managerial post | ||||
| Number of managerial post |
Male Female |
88(89.8%) 10(10.2%) |
87(88.8%) 11(11.2%) |
74(85.1%) 13(14.9%) |
| Employment of persons with disabilities (legal definition) | ||||
| Employment of persons with disabilities (legal definition) |
Number of person |
17 |
14 |
11 |
* Employees, etc. including non-regular employees but excluding directors and executive officers.
** In the fiscal year ending June 2025, coinciding with our transition to a holding company structure, we undertook a strategic optimization of talent allocation throughout the group to fortify our basis for sustainable growth. The reported employee turnover rate for this period is elevated because it includes employees who moved between group companies as part of this internal reorganization.
Situation of taking leaves
| Fiscal Year Ending June 30, 2023 |
Fiscal Year Ending June 30, 2024 |
Fiscal Year Ending June 30, 2025 |
||
|---|---|---|---|---|
| Number of employees, etc. who took maternity leave |
||||
| Number of employees, etc. who took maternity leave |
Number of person |
5 |
4 |
4 |
| Number of employees, etc. who took childcare leave | ||||
| Number of employees, etc. who took childcare leave |
Male Female |
10 7 |
13 3 |
14 6 |
| Rate of return after childcare leave | ||||
| Rate of return after childcare leave |
Male (%) Female (%) |
100 100 |
100 100 |
100 100 |
| Rate of male employees, etc. taking childcare leave | ||||
| Rate of male employees, etc. taking childcare leave |
(%) |
76.9 |
81.8 |
82.4 |
| Fiscal Year Ending June 30, 2023 |
Fiscal Year Ending June 30, 2024 |
Fiscal Year Ending June 30, 2025 |
||
|---|---|---|---|---|
| Rate of taking paid leave | ||||
| Rate of taking paid leave |
(%) |
85.2 |
86.2 |
84.1 |
| Average number of days taken for paid leave | ||||
| Average number of days taken for paid leave |
- |
15.7 |
15.8 |
15.4 |
* Employees, etc. including non-regular employees but excluding directors and executive officers.