Organization chart/HR related data
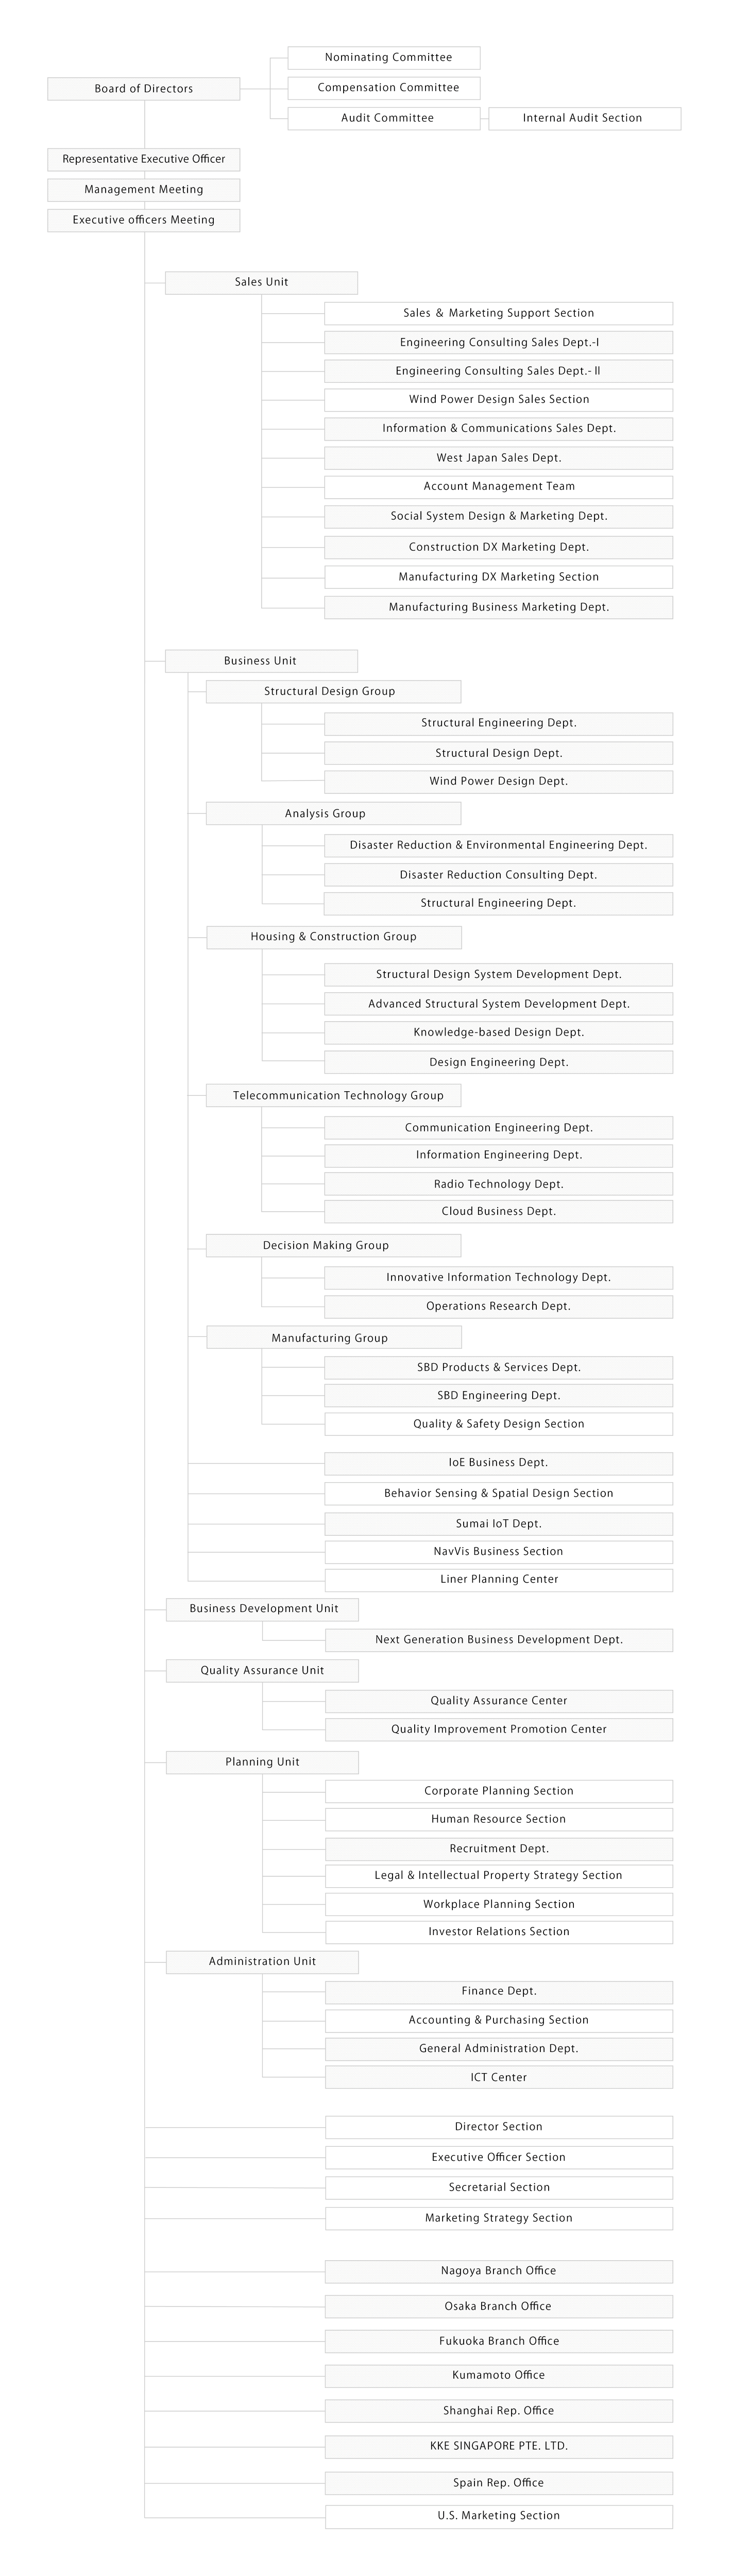
Organization chart
Revised on Sept.2023
Data on Employees, etc.
| Number of employees, etc. | ||||
|---|---|---|---|---|
| Fiscal Year Ending June 30, 2021 |
Fiscal Year Ending June 30, 2022 |
Fiscal Year Ending June 30, 2023 |
||
| Number of employees, etc. |
Total Male Female |
607 437 170 |
621 457 164 |
642 471 171 |
|
Japanese Non-Japanese |
568 39 |
587 34 |
602 40 |
|
| Average age |
All employees, etc. Male Female |
41.7 42.6 39.4 |
41.8 42.3 40.4 |
41.7 42.2 40.2 |
| Average service years |
All employees, etc. Male Female |
15.0 16.0 12.3 |
15.0 15.5 13.3 |
14.8 15.2 13.5 |
| Average annual salary |
All employees, etc. |
861 |
876 |
986 |
| Employment of new graduates | ||||
|---|---|---|---|---|
| Fiscal Year Ending June 30, 2021 |
Fiscal Year Ending June 30, 2022 |
Fiscal Year Ending June 30, 2023 |
||
| Employment of new graduates |
Total Male Female Non-Japanese |
22 14 8 3 |
38 30 8 4 |
43 31 12 11 |
| Employment of experienced professionals |
Total |
6 | 15 | 13 |
| Ratio of employment of experienced professionals |
Total (%) |
21.4 | 28.3 | 23.2 |
| Number of employees, etc. who left the company |
Total |
30 | 38 | 31 |
| Turnover rate |
Total (%) |
4.9 | 6.2 | 4.8 |
| Number of managerial post | ||||
|---|---|---|---|---|
| Fiscal Year Ending June 30, 2021 |
Fiscal Year Ending June 30, 2022 |
Fiscal Year Ending June 30, 2023 |
||
| Number of managerial post |
Male Female |
76(89.4%) 9(10.6%) |
82(89.1%) 10(10.9%) |
88(89.8%) 10(10.2%) |
| Employment of persons with disabilities (legal definition) |
Number of person |
12 |
13 |
17 |
* Employees, etc. including non-regular employees but excluding directors and executive officers.
Situation of taking leaves
| Number of employees, etc. who took maternity leave |
||||
|---|---|---|---|---|
| Fiscal Year Ending June 30, 2021 |
Fiscal Year Ending June 30, 2022 |
Fiscal Year Ending June 30, 2023 |
||
| Number of employees, etc. who took maternity leave |
Number of person |
1 |
3 |
5 |
| Number of employees, etc. who took childcare leave |
Male Female |
11 7 |
10 2 |
10 7 |
| Rate of return after childcare leave |
Male (%) Female (%) |
100 100 |
100 100 |
100 100 |
| Rate of male employees, etc. taking childcare leave |
(%) |
58.8 |
37.5 |
76.9 |
| Rate of taking paid leave | ||||
|---|---|---|---|---|
| Fiscal Year Ending June 30, 2021 |
Fiscal Year Ending June 30, 2022 |
Fiscal Year Ending June 30, 2023 |
||
| Rate of taking paid leave |
(%) |
78.7 |
87.2 |
85.2 |
| Average number of days taken for paid leave |
- |
14.4 |
16.0 |
15.7 |
* Employees, etc. including non-regular employees but excluding directors and executive officers.